November 2008 November 2008 | ||
 |
Food Outlook | |
| Global Market Analysis | ||


|
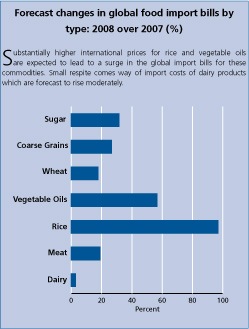
MARKET INDICATORS AND FOOD IMPORT BILLSFalling food prices and freight costs fail to dent a USD 1 trillion bill in 2008 As 2008 draws to a close, the global cost of imported foodstuffs in 2008 is increasingly likely to break the USD1 trillion barrier. The prediction comes in spite of sharp falls in freight rates and pervasive declines in international prices of foodstuffs that began mid year and accelerated thereafter. At USD 1019 billion, the total food import bill facing the world would be some 23 percent higher than in 2007 and 64 percent the year before that. Of the estimated USD 200 billion or so global increase from 2007, vegetable oils could account for over one-third of the rise and coarse grain based foodstuffs for about a quarter. In fact, with the exception of sugar, expenditures on imported food by commodity group are all estimated to reach unprecedented levels. International quotations, which even in the face of recent declines, remain much higher than last year constitute the main driver of record import bills in 2008. Freight charges have also been a factor, despite the near collapse in quotations in recent months. Hitherto, freight costs had been soaring, reaching unparalleled levels in mid 2008, adding on average roughly 10 percent to import expenditures since last year. The third variable in the import equation - volume - has held remarkably firm in the wake of such high unit costs. The global market for wheat, vegetable oils, meat and dairy products all should experience record traded volumes in 2008, while world trade in rice and coarse grains could all but register the highest levels, bar 2007. Such resilience bears testimony to the importance of trade to assure food consumption around the world. However, the global picture masks significant difficulties that vulnerable countries are likely to endure. Record increase in food import bills of the world’s poorest countries Among economic groups, developing countries look set to bear the brunt of escalated food import costs. The burden of purchasing food on the international market place for the most economically vulnerable groups, LDCs and LIFDCs, is set to soar by around a third each from last year. This would stand as the largest year-to-year increase on record. Bills in sub-Saharan Africa could rise in slightly less proportion, but again, the annual rise would constitute a record for the region. The sheer encumbrance facing some of the world’s poorest countries in importing food can be contrasted against that of richer nations, whose food import bills are likely to rise by only 18 percent from 2007. Rising food import bills do not necessarily result in more imported food. Numerous LDCs and LIFDCs are expected to curb procurement of basic foodstuffs from international markets, a response that does not always reflect improved domestic supply prospects. The world will look towards 2009 for respite given the outlook for further declines in international prices and freight costs. But the prospect of lower food import expenditures for many countries, especially the poorest, could be undermined by the crisis in global financial markets, as they may find it harder to secure finance for their imports. Forecast import bills of total food and major foodstuffs (US$ million)
|
||||||||||||||||||||||||||||||||||||||||||||||||||||||||||||||||||||||||||||||||||||||||||||||||||||||||||||||||||||||||||||||||||||||||||||||||||||||||||||||||||||||||||||||||||||||||||||||||||||||||||||||||||||||||||||||||||||||||||||||||||
| GIEWS | global information and early warning system on food and agriculture |