November 2008 November 2008 | ||
 |
Food Outlook | |
| Global Market Analysis | ||


|
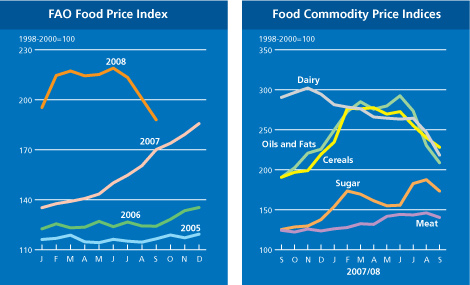
THE FAO PRICE INDEX
The FAO Food Price Index (FFPI) dropped another 6 percent in September, falling to a nine-month low of 188 points. The sharp decline in the index reflected the rapid decrease in international prices of all major food and feed commodities (composing the FFPI). The FFPI rose steadily since early 2006, climbing to a record 219 points in June 2008. In spite of its continuing decline since that month, the FFPI was still up 11 points from its value last September and as much as 51 percent above the level in September 2006. After reaching a high of 278 points in June 2008, the FAO Cereal Price Index fell to 228 points in September, down 5 percent from the previous month but still up 10 percent from the corresponding period last year. International cereal prices remained under downward pressure in September in anticipation of a strong rebound in world supplies. Developments in other markets, particularly the energy and financial markets, also contributed the drop in prices of major cereals. The FAO Oils/Fats Price Index fell further to 209 points in September, which is 28 percent below the June record and only 10 percent above the level recorded in September 2007. Subdued demand in response to previous record high prices coupled with an improved global 2008/09 supply outlook, are by and large behind the fall. In addition, the recent downturn in energy prices and the prospect of a general slow down in economic growth have also contributed to the price development. The FAO Meat Price Index fell to 140 points in September, 4 percent below its peak in August. Meat prices rose steadily since the beginning of 2008 but rising slaughtering rates combined with a slowdown in demand have begun to put downward pressure on meat prices in September. The FAO Dairy Price Index fell to 218 points in September, down almost 12 percent from August. The price index has now fallen by about 28 percent from its peak in November 2007. Milk powder prices have dropped the most from year ago levels, with skim powder prices fell by 39 percent and whole milk powder dropped by 31 percent. Butter and cheese prices remained relatively resilient, with their prices down 9 and 11 percent respectively. The FAO Sugar Price Index averaged 173 points in September, down about 7 percent from the previous month and 39 percent above the corresponding period of last year. The September decline in the price index largely reflected the influence of factors outside the sugar market, namely declining crude oil prices and a strengthening of the United Stated dollar.
|
||||||||||||||||||||||||||||||||||||||||||||||||||||||||||||||||||||||||||||||||||||||||||||||||||||||||||||||||||||||||||||||||||||||||||||||||||||||||||||||||||||||||||||||||||||||||||||||||||||||||||||||||||||||||||||||||||||||||||||||||||||||||||||||||||||||||||
| GIEWS | global information and early warning system on food and agriculture |