 December 2009 December 2009 | ||
 |
Food Outlook | |
| Global Market Analysis | ||


|
MARKET SUMMARIES
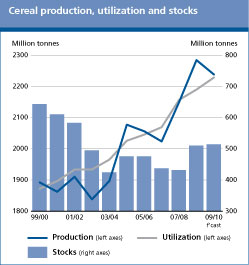
A combination of a good outlook for production and relatively high opening stocks should lessen concerns about the cereal supply situation in the 2009/10 marketing season. The overall improvement in the global supply and demand balance is underscored by the ratio of world cereal stocks to utilization, an important indicator for global food security, which is expected to remain unchanged from the previous season at an above-average level of 23 percent. Developments in international prices also confirm the return, albeit slow, of cereal markets towards a more balanced situation, as reflected in the FAO Cereal Price Index, which, in January-November 2009 has averaged 29 percent less than during the corresponding period last year and as much as 40 percent below its peak in April 2008. As for 2010, the preliminary outlook for production points to a decline in plantings, mostly on account of lower price expectations. In the European Union and the CIS, barley is foreseen to be most affected while winter wheat plantings in the United States may also be negatively influenced by the low price prospects. World cereal market at a glance 1/
* January-November 2009
1/ Rice in milled equivalent
2/ Trade data refer to exports based on a July/June marketing season for wheat and coarse grains and on a January/December marketing season for rice.
3/ Low-Income Food Defecit Countries
Wheat production in 2009 is forecast to fall slightly below last year's record while stocks are expected to increase for the second consecutive season, given an only modest expansion envisaged for world wheat utilization. With world trade in 2009/10 falling sharply below the previous season's record volume, mostly due to large harvests in importing countries in North Africa and Asia, international wheat prices fell during the first three months of the 2009/10 season, between July and September. However, prices started to increase in October, supported by strength in other major cereal markets and the weak United States Dollar. With the world inventory remaining at a comfortable level and continued support in several countries for higher wheat plantings next year, there should be less of an upside risk of higher prices in the coming months. However, given the increasing linkages with other markets, and the high degree of uncertainty that prevails in many of those markets, a period of volatile and even rising prices cannot be ruled out. World wheat market at a glance
* Derived from International Grains Council (IGC) Wheat Index
** January-November 2009
Wheat trade data refer to exports based on a common July/June marketing season
1/ Major exporters include Argentina, Australia, Canada, EU and the United States 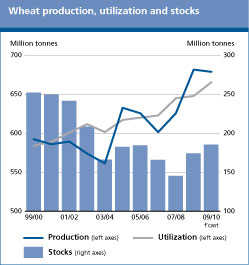
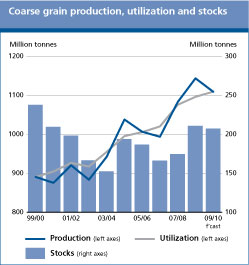
The forecast decline in world production, combined with an expected reduction in stocks and a recent further strengthening in international prices, all point to a tightening supply and demand balance for coarse grains. Although world trade is seen to decline slightly below the previous season's reduced level, export supplies are also lower than in the previous season, with sharp reductions especially in Argentina and the CIS exporting countries. The bulk of the contraction in world trade is expected in barley and to a lesser extent in sorghum, while trade in maize is forecast to increase. The potential for a more sustained increase in international prices in the coming months appears limited as overall demand prospects from feed and fuel sectors remain less brisk than last year, but developments in outside markets, energy and soybeans in particular, will continue to be influential. World coarse grain market at a glance
* January-November 2009
Coarse grains trade data refer to exports based on a common July/June marketing season
1/ Major exporters include Argentina, Australia, Canada, EU and the United States
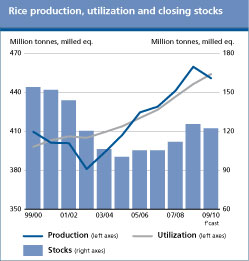
The most salient feature of the world rice sector in 2009 is the anticipated contraction in global rice output, the first since 2002, following an erratic pattern of the southwest Asian monsoon and other setbacks. Severe losses in the Philippines and other countries have brought back momentum to world import demand and to international prices, but have also raised concerns over export supplies in 2010. Although reserves will need to be drawn down somewhat in 2010 to meet the gap between global production and consumption, overall they are foreseen to remain adequate. However, stocks held by major exporters may fall substantially in 2010, both volume-wise and as a share of disappearance, which may underpin prices further in the next few months. World rice market at a glance
1 Calendar year exports (second year shown).
2 Major exporters include India, Pakistan, Thailand, the United States of America and Viet Nam.
More detailed information on the rice market is available in the FAO Rice Market Monitor which can be accessed at: http://www.fao.org/es/esc/en/15/70/highlight_71.html
* Jan-Nov 2009.
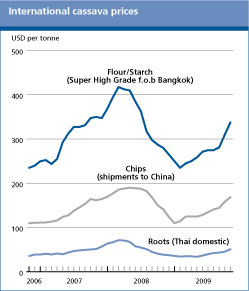
Global cassava production is set to rise to a new high in 2009, driven by initiatives to sustain food security, and to meet the needs of the ethanol sector where cassava has emerged as a key feedstock. World trade in cassava products is set to undergo a considerable expansion by the end of the year, but with the retreat from the import market by the European Union, trade will be confined mostly to Asia. Thailand, once again, is expected to be the leading source of trade supplies, but its dominance is set to be challenged by the arrival of Viet Nam on the international market. On the import side, China is likely to remain the major destination of trade in cassava products. Prices of internationally traded cassava products have staged a sharp rally in recent months, but annual averages still remain below 2007 levels. Domestic policies in the markets of the principal exporters and importers of cassava have paved the way for a surge in demand, and hence price quotations are expected to remain firm in 2010, though much will depend on the demand for cassava products for feed, alcohol, or ethanol production, which in turn will rest on the pattern and speed of the economic recovery. World cassava market at a glance
* Source: Thai Tapioca Trade Association
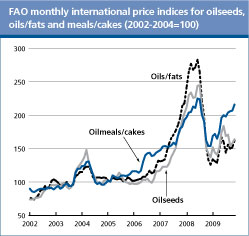
Following tight markets in 2007/08 and 2008/09, during 2009/10, a gradual easing of the global supply and demand situation appears likely, in particular with regard to meals and possibly soybeans. In the market for meals and cakes, a weakening in prices is possible later into the season but only if, as expected, a large South American crop becomes available. By contrast, in the oils and fats market, a tighter supply and demand situation could strengthen prices as the season advances. However, in general, the markets for oilseeds and oilseed products are likely to remain vulnerable during 2009/10 as supplies are expected to be less ample relative to demand than in past years and prices may well remain volatile. Moreover, at this early stage of the season the market faces some major uncertainties, in particular possible weather-related problems in South America and Southeast Asia, but also changes in the global economy, developments in mineral oil prices and exchange rates and possible adjustments in biofuel and trade policies. World trade flows of both oils/fats and meals/cakes are expected to stall in 2009/10 as major importing countries hold relatively ample supplies, while, among exporters, the need to replenish stocks may limit export availabilities. World oilseed and product markets at a glance
Note: Refer to Table 12 for further explanations regarding definitions and coverage
*Jan-Nov 2009
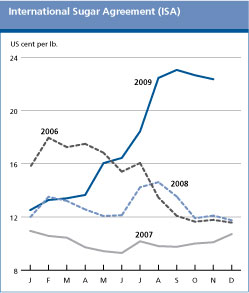
Since the publication of the last report in June, the International Sugar Agreement daily prices have continued to rise sharply, reaching a 28-year high of the United States on 31 August 2009. By mid-November, prices were still firm. World sugar production is expected to recover somewhat in 2009/10, largely due to favourable weather conditions and prices. Nevertheless, production is anticipated to remain short of consumption for the second consecutive year, with the deficit estimated in the order of 3 million tonnes. As a result, global reserves are foreseen to decline remaining, however, rather high, both in absolute terms and as a share of utilization. Global consumption in 2009/2010 is expected to grow below the ten-year trend. World trade may expand by 5 percent, sustained by strong import demand in India. Looking ahead, world sugar prices are expected to remain firm but at a level below the current highs. World production and consumption of sugar
* Jan-November 2009
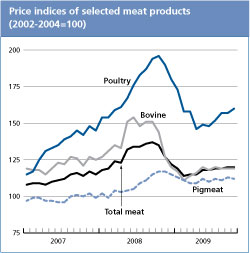
According to the FAO meat price index, world meat prices were on average 8 percent lower in the first ten months in 2009 than in the corresponding period last year but still some 5 percent above the level prevailing in 2007. The index reached its lowest point in February 2009 and since then, has staged a mild recovery, with tendencies diverging across the representative trading markets. Contingent on the consolidation of the world economic upturn, prices may gather momentum in 2010, particularly for beef and pig meat. The forecast of global meat production in 2009 has been revised downwards and is now anticipated to expand only marginally. However, growth may rebound in 2010, largely on the back of relatively strong gains in pig and poultry meat. Poor global import demand is expected to depress world trade in all the various meat categories in 2009 but, overall, a modest recovery is anticipated for 2010. World meat markets at a glance
* Jan-Nov 2009
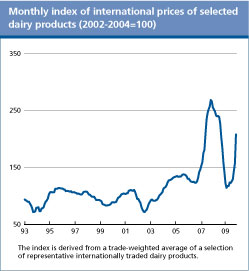
Dairy prices are on the rise again. Since its recent low in February 2009, the FAO Index of International Dairy Product Prices has gained over 80 percent and now has returned to its level of August 2008. Prices of butter have doubled while prices of cheese and milk powders have increased by 70 percent and over 90 percent, respectively. The reason for rising international prices appears to be declining exports in 2009, mainly from the European Union and the United States, even while the largest exporter, New Zealand, is increasing its deliveries. Global trade is expected to fall by 5 percent in 2009. The contraction coincides with rising demand in Asia and in various oil exporting states, which is further underpinning prices. Over the next few months, the pattern of prices will very much depend on whether the European Union will keep its large stocks of butter and especially skim milk powder off international markets. Global milk production is expected to advance by only one percent in 2009, but to resume a trend growth of about 2 percent in 2010. Dairy product may also rebound and keep price increases in check. World dairy markets at a glance
* Jan-Nov 2009
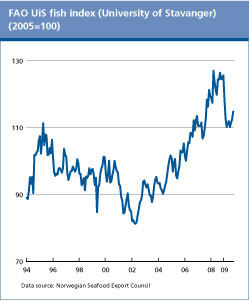
On balance, 2009 has been a challenging year for fisheries following the global economic downturn that induced a general sector-wide demand-led contraction. Although trade is slowly beginning to expand in several key markets, activity remains far below the levels registered in the run up to the recession. As a result, 2009 import values and volumes are forecast to end up lower than those of last year: While the process of recovery in some markets will be lengthy, the outlook for 2010 remains generally positive as does the longer-term trend for fish trade, with rising shares of production in both developed and developing countries entering international markets. The trend in falling fish prices which began in late 2008 appears to have finally abated. Moderate price increases for most species have been registered for several months in succession. This development reflects a resurgence in demand against lower supply potential in the recession-hit farmed fish sector. World fish market at a glance
1 FAO University of Stavanger Fish Price Index
|
||||||||||||||||||||||||||||||||||||||||||||||||||||||||||||||||||||||||||||||||||||||||||||||||||||||||||||||||||||||||||||||||||||||||||||||||||||||||||||||||||||||||||||||||||||||||||||||||||||||||||||||||||||||||||||||||||||||||||||||||||||||||||||||||||||||||||||||||||||||||||||||||||||||||||||||||||||||||||||||||||||||||||||||||||||||||||||||||||||||||||||||||||||||||||||||||||||||||||||||||||||||||||||||||||||||||||||||||||||||||||||||||||||||||||||||||||||||||||||||||||||||||||||||||||||||||||||||||||||||||||||||||||||||||||||||||||||||||||||||||||||||||||||||||||||||||||||||||||||||||||||||||||||||||||||||||||||||||||||||||||||||||||||||||||||||||||||||||||||||||||||||||||||||||||||||||||||||||||||||||||||||||||||||||||||||||||||||||||||||||||||||||||||||||||||||||||||||||||||||||||||||||||||||||||||||||||||||||||||||||||||||||||||||||||||||||||||||||||||||||||||||||||||||||||||||||||||||||||||||||||||||||||||||||||||||||||||||||||||||||||||||||||||||||||||||||||||||||||||||
| GIEWS | global information and early warning system on food and agriculture |
