 December 2009 December 2009 | ||
 |
Food Outlook | |
| Global Market Analysis | ||


|
THE FAO PRICE INDICES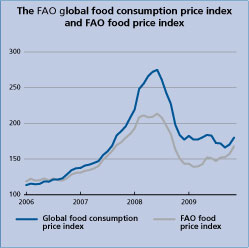
Launched in the June 2009 issue of Food Outlook, ' The Global Food Consumption Price Index' tracks changes in the cost of the global food basket as portrayed by the latest FAO world food balance sheet (see http://faostat.fao.org/). Representative international prices for each of the commodities or commodity groups appearing in the balance sheet are weighted by their contribution to total calorific intake. The index fell to a 25 month low in September 2009, before gaining ground to almost 180 basis points in November. This implies that the cost of the typical food basket is now some 80 percent more than what it was in 2002/04. A slight recovery in cereal prices in recent weeks, which hitherto had been steadily been falling, combined with a sharp rise in dairy product prices, has led to the index being more aligned to movements in the export weighted FAO Food Price Index.
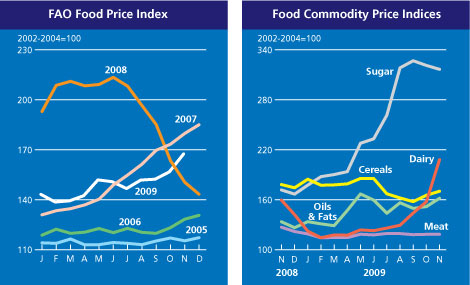
The FAO Food Price Index (FFPI) averaged 168 points in November 2009, up 7 percent from October. At this level, the FFPI stands at its highest level since September 2008 but still down 21 percent from its peak in June 2008. The FFPI has gained strength in recent months owing to increases in world prices of nearly all food commodities. The sharp rise in November reflected a continuing strong recovery in international dairy prices as well as higher oils and cereal prices. By contrast, international sugar prices dropped below their October highs while meat values remained unchanged. The FAO Cereal Price Index averaged 170 points in November 2009, up almost 3 percent from October but down 38 percent from its April 2008 all time high of 274 points. The near record 2009 cereal crop and a continuing improvement in the level of world cereal inventories kept cereal prices below levels of last year. However, recent weeks have witnessed a renewed strength in the prices of major cereals, mostly on the back of delays in maize harvesting in the United States, anticipation of a decline in winter wheat plantings and stronger import demand for rice than earlier anticipated. External developments have also been responsible, including a weakening of the United States Dollar, higher prices of soybeans and stronger energy markets. The FAO Oils/Fats Price Index reached 162 points in November 2009, which is 6.6 percent above the October value. Excluding 2007-08, the period of the extraordinary price swing, the corresponding value in November 2006 was 124. The current price strength reflects strong import demand and active investment fund buying, that coincide with relatively tight export supplies, recovering mineral oil prices and further weakness in the United States currency. Recently, prices also reacted to weather related delays in oilseed planting in Argentina, one of this season's key sources of supply. The prospects of a continued strong demand and of a limited recovery in stocks during 2009/10 point toward prolonged price firmness in the sector. The FAO Index of Dairy Product Prices has increased by over 80 percent from its low in February 2009. Prices in international dairy markets have undergone a significant recovery in recent months, rising some 33 percent in November alone. Most of the increase has occurred since August as economic recovery has taken hold in Asia and in certain oil exporting countries. Export supplies remain tight, particularly given only marginal increase in milk production in Oceania and lower output in the United States. A critical factor for global markets is the retention by the European Union of large Slim Milk Powder and butter stocks, which has restricted its exports. The FAO Sugar Price Index reached 317 points in November 2009, down 1.5 percent from October. However, on average, the index in January-November 2009, at 250 points, was 37 percent higher than the corresponding period in 2008. While a gradual increase in sugar prices in 2009 was to be expected, given the tightening of the global market, the speed and magnitude of the run-up suggest an overreaction of the market to an expected surge of imports by India and to a poor outlook of crops in Brazil in 2009/10. The FAO meat price index hovered around 118 points between September and November 2009, substantially lower than the levels prevailing in the same period last year. Over January-November 2009, meat prices remained largely steady, averaging 117 points or 9 percent less than in the same period in 2008. The meat sector appears to have been hit most severely by the contraction in world demand ensuing from the economic downturn. Only prices of poultry meat have given some signs of recovery in recent months, a tendency that was not shared by pigmeat or bovine meat. 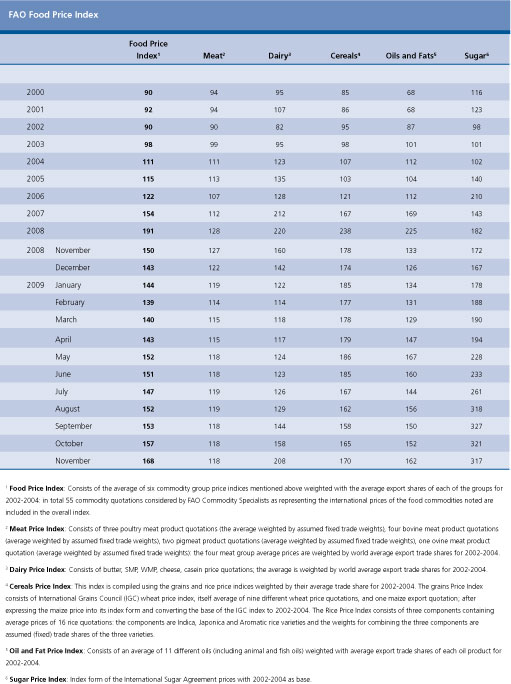
|
| GIEWS | global information and early warning system on food and agriculture |