 December 2009 December 2009 | ||
 |
Food Outlook | |
| Global Market Analysis | ||


|
OCEAN FREIGHT RATESContributed by the International Grains Council (IGC) (http://www.igc.org.uk)
The dry bulk freight market strengthened considerably since mid-May but displayed much volatility, particularly in the (non-grain) Capesize sector, which reacted strongly to changes in mineral chartering activity. After rising steeply in May and early June due to sharply increased chartering activity and tight availability of ships, Capesize rates fell back heavily in the following four months as mineral demand subsided and port congestion in China eased. While the downturn affected the other dry bulk sectors, these were relatively steadier, underpinned by a good volume of business, including grains, particularly in the Atlantic, where tonnage supply remained tight. At the end of September, Capesize rates again soared on a renewed surge in Asian minerals demand and reduced tonnage availability, regaining all the lost ground. These movements had a considerable impact on the Panamax sector but much less so on Handysize rates, which showed a more consistent gradual upward trend over the six months. In November rates continued to climb in all market sectors, with charterers favouring tonnage for short periods rather than the more expensive voyage deals. Bad weather in eastern and northern China worsened port congestion and limited the availability of larger vessels. Between mid-May and end-November 2009 the Baltic Dry Index (BDI) climbed by 72 percent, mainly attributable to the sharp increases in the Capesize sector. Over the same period, the IGC Grain Freight Index (GFI),8/ which does not include Capesize vessels, advanced by about 20 percent. After peaking at the beginning of June, largely mirroring the strength of the Capesize sector, Panamax rates remained relatively firm for a period, bolstered by heavy demand, particularly in the North Atlantic. Rates then succumbed to the general weakness in the dry bulk market but subsequently steadied. They climbed sharply in October, boosted by busy coal and grains chartering on routes to Europe and Far East Asia, as well as tighter tonnage supply. The Panamax market benefited from the splitting of Capesize cargoes into smaller shipments. The most commonly quoted transatlantic round voyages rose from about USD 25 000 daily in May to about USD 39 000 in November. On routes from South America to Europe rates were recently quoted at USD 27 000 daily. North Pacific rates were also firmer due to a heavier volume of enquiries, especially after coal from Australia and iron ore from India became cheaper than in China. Rates on the route from Indonesia to China climbed to USD 35 000 daily. In the timecharter market, short period contracts for four/six months were quoted at about USD 31 000 daily in the Atlantic and USD 29 000 in the Pacific. In the Handysize/Supramax sector, Atlantic rates were generally steadier over the whole period, firming on solid demand for grains and limited spot tonnage availabilities in the US Gulf, northern Europe, the Black Sea and the Mediterranean. Recent grain fixtures from the US Gulf and South America to Northern Africa and Europe ranged between USD 29.00 and USD 31.00/tonne. A short-period timecharter was settled at USD 18 250 daily. In the Pacific, rates from the Indian Ocean were very strong, those to China quoted at about USD 33 000 daily. A build-up of surplus tonnage saw Capesize rates fall sharply in July after the steep increases seen in previous months. This reflected China's much-reduced mineral demand, particularly from ports in Brazil and Western Australia, exacerbated by the growing Capesize fleet. The fall was also attributed to a seasonal downturn in coal shipments, easing port congestion in China, with more ships becoming available, and a decline in the freight futures market. However, after falling by nearly 70 percent during the third quarter of the year, rates rebounded in October on renewed iron ore and coal buying interest from China, returning to the levels seen in June 2009. 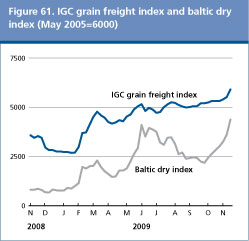
8. The GFI distinguishes grain routes from mineral and other dry bulk routes also included in more general dry bulk indices such as the Baltic Dry Index (BDI). The GFI is composed of 15 major grain routes, representing the main grain trade flows, with five rates from the United States, and two each from Argentina, Australia, Canada, the European Union and the Black Sea. Vessel sizes are adequately represented, with ten Panamax rates and five in the Handysize sector. The GFI is calculated weekly, with the average for the four weeks to 18 May 2005 taken as its base of 6 000. |
| GIEWS | global information and early warning system on food and agriculture |
