December 2009 December 2009 | ||
 |
Food Outlook | |
| Global Market Analysis | ||


|
Special features
(This special feature is courtesy of Wright, Brian, D. and Bobenrieth, Eugenio, University of California, Berkeley and University of Concepcion, Chile). The views expressed herein do not necessarily reflect the official opinion of the Food and Agriculture Organization of the United Nations)
The food price crisis of 2007/2008 triggered widespread concern over the volatility experienced in agricultural commodity prices and perhaps more worrisome, concerns that the world had entered a new grain market regime in which such volatility will persist unless strong policy measures are adopted. Several reports claim that grain prices have been drastically inflated by manipulative financial speculation. The fear is that such trading has undermined the price-smoothing capacity of agricultural futures markets, and increased the price risks encountered by consumers, producers and governments. Consumers in many developing countries, alarmed by increases in the cost of their staple foods, demanded policy responses from their political leaders. The FAO Secretariat's contribution to defining the objectives and possible decisions of the World Summit on Food Security of November 2009 proclaims the need "to address the issue of speculation in agricultural markets given the serious implications it can have for world food security." It notes that "some studies suggest that speculation in food markets played a certain role in the increasing level and volatility of world food prices in 2007-2008" and calls upon the World Bank, the IMF, UNCTAD, FAO and other relevant intergovernmental organizations "to conduct in-depth and comprehensive studies to analyse the causal links between speculation and agricultural commodity price movements, with a view to fostering a coherent and effective policy response in the context of food security." The 2009 UNCTAD Trade and Development Report (p. IV) stated that "Recognizing the lack of economic logic of these [financial and commodity] markets is key to understanding the roots of the current crisis, and should be the basis for further policies and reforms aimed at stabilizing the financial system." Is the beginning of a new regime characterized by more volatile, if not higher, commodity prices being witnessed? Is the recent turmoil in prices an aberration, involving emergence of new, irrational bubbles, unconnected to market fundamentals? Is it the fruit of purposeful manipulation by global financial forces moving on to disrupt agricultural commodity markets after contributing to a financial bubble that wreaked havoc in the international macroeconomy? Has a lack of regulation of futures and options markets, and/or global international financial flows contributed to the emergence of this new era of market chaos? How significant is the role of expansion of biofuels supply in destabilizing grain markets? The answers to many of these questions could have important policy implications. Unfortunately, answers are difficult to find, given the state-of-the-art in modelling commodity and financial markets. For the major grains, wheat, maize and rice, which are so important in feeding the population of the world, progress can be made by examining the available market data at an aggregate level. The question asked in this paper is whether the recent price spikes appear to be qualitatively different from previous episodes observed over the past four decades. Are they new phenomena indicative of a new market regime? Or are they consistent with the operation of commodity intergrain substitution in use for food and feed, and of storage as intertemporal arbitrage, as reflected in market movements over the past several decades? This paper addresses this issue as a necessary first step in evaluating the merits of "corrective" actions being discussed regarding policies affecting futures markets, agricultural markets and the markets for inputs.
Consider first the recent price behaviour in the markets for the major grains. Figures 1 through 3 show the price histories of the three major grains wheat, maize and rice, in United States Dollars deflated by the Consumer Price Index. 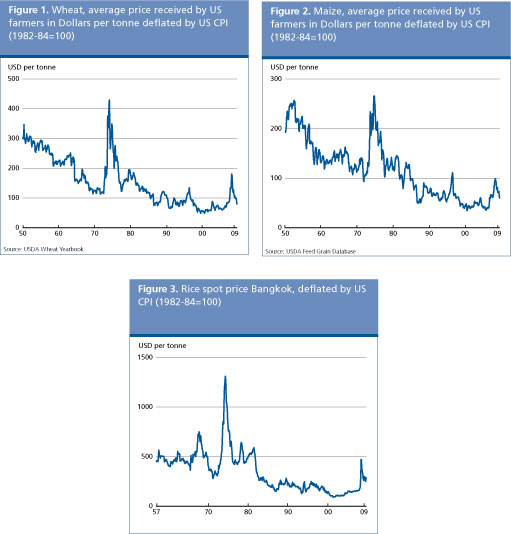
In each case the price shows a notable downward trend, and fluctuations usually within a fairly narrow range. This downward trend is no doubt related to the remarkable success of plant breeders and farmers in generating crop yields that outpaced the demand shifts generated by worldwide income increases and by population growth in the third world. Occasional steep spikes in price followed by equally precipitous falls are another prominent feature of the data. It is clear that when price is locally high it is also highly volatile, and when price is low it is also more stable. Figure 4 shows the prices of these three grains along with the prices of soybeans, crude oil and all food, from January 1970. It is clear that all of these commodities had very sharp price increases in the period between 1973 and 1975, and between 2007 and 2008 spikes again occurred in the price of each of these commodities. 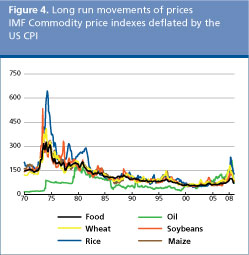
Some observers saw in the recent history of prices a recurrence of the events of the early 1970s. However Figure 4 shows that the recent episode of price spikes was far less dramatic in real terms than the episode in the 1970s. Moreover, as others noted, the international economic situation in the last few years has been very different from that of the 1970s. Many market participants and observers have identified huge international financial flows, low interest rates and the recent creation of a bewildering array of markets in financial derivatives as new and powerful sources of market volatility, which they claim must be controlled by new regulations on financial and commodity markets. An important question is whether the international grain markets are behaving in ways recognizable from a history of the last four decades? Or have these markets entered a new and more volatile regime and require new and different regulations or other interventions to prevent a continuation of the kind of chaos we have seen of the last several years?
Focusing on the world market as a whole, it is important to understand that storage activity is asymmetric. When an abundant supply is on hand after a good harvest, excess supplies can always be placed in storage to be consumed in later years. A subsequent shortfall in production or shock to demand can be cushioned by drawing down the accumulated stocks to maintain reasonable levels of consumption. However if current stocks are at minimal levels, a production shortfall must be accommodated by a corresponding adjustment on aggregate consumption. For grains such as maize and to a lesser extent wheat that are used as feed for animals and for food for humans, it has generally been true that most of the adjustment to negative shocks is made in the consumption of animal feed, which entails the short run benefit of a surge in supply of meat to consumers. If the shortfall cannot be met by adjustments in non-food uses, consumers must be forced by increased price to absorb the shortfall by reducing their own consumption. Rich and middle-class consumers typically make little or no adjustment, absorbing the price shock by reducing their savings or adjusting their consumption of less necessary goods. So the burden falls on consumers who are poor. They attempt desperately to cover the increased cost of their normal diet by adjusting their savings or non-essential consumption, so a large increase in price is needed to achieve a relatively small reduction in their consumption. At the aggregate level, the relation between the available supply and price has been difficult to model and to estimate, due to challenges in accurately measuring consumption and its response to price variations. However, substantial progress has been made in estimating the price response even when adequate data distinguishing consumption and stocks are not available.2/ The results indicate that at very high prices, when stocks are minimal, the consumption response to price is very inelastic. Although the data on global stocks are notoriously unreliable, the available information is nevertheless informative about interpreting recent market events in the context of the history of the last four decades. Figures 5 through 7 show stocks to use ratios for wheat, maize and rice. 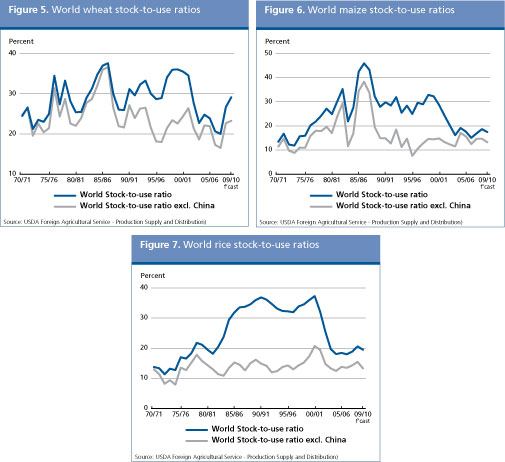
The ratios are reported for the global market, and for the market excluding China. Chinese policies have in some periods, for example the 1990s, meant that China's grain economy has been essentially independent of the rest of the world, and stocks have been difficult to measure and verify. Note that, excluding China, the minimum ratio of stocks to use appears to be similar in different decades, with the exception of rice, for which the reported 1972-1974 ratio is a low outlier. This reflects the fact that operation of a grain market entails use of a virtually irreducible minimal level of stocks necessary for the efficient operation of transport, marketing and processing of grains. For maize the minimum reported ratio was in 1995/1996, while for wheat it occurred in 2007/08, when rice stocks were only moderately low. The demands for the three major grains are not independent, because each is an important supplier of calories for food and feed uses. On the other hand it is obvious to any consumer that they are not on average perfect substitutes. However, their price series are highly correlated. We aggregate the calories in the three major grains and examine them as if calories were traded on one unitary global market.11/ The World's and China's total consumption and ending stocks data are from USDA PSD Online. In order to conduct the conversion, calorie data from the USDA National Nutrient Database are used. Losses in calories between the harvest and the consumer are ignored. For meaningful inferences the crucial assumptions are that food loss ratios are roughly the same for wheat, maize and rice, and do not vary too much over time. The result is presented in Figure 8: 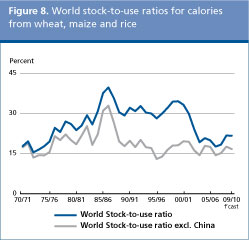
Note that aggregate stocks were very low in the early 1970s, and similarly low in 1996/1997, 2002/2003 and 2007/2008. These are indeed the epochs with lowest aggregate reported stocks since 1960. It is clear that the minimal aggregate stocks to use ratio is around 12 to 14 percent. Next we construct a price index for calories. The price is United States Dollars per tonne. Wheat price is for all wheat, United States, average from USDA. Rice price is for Thai, 5 percent broken, f.o.b. Bangkok. Maize price is average cash price of Maize No. 2 Yellow. For each grain, we can roughly estimate the content of calories per tonne using data from United States National Nutrient Database. Dividing the observed price by the amount of calories per tonne, we can obtain the price of calories as United States Dollars/kcal contained in wheat, maize and rice, respectively. The prices of calories from each grain are presented in Figure 9 below: 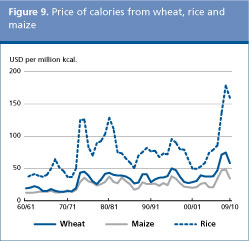
Calorie data are also used to convert export measured in tonnes into calories. Share of calorie consumption of each grain out of the total calorie consumption is used as weight. Note the very close relationship between the maize and wheat prices per calorie, and the strong co-movement of the rice price, at a higher level (all correlations are around 0.9 or higher). To obtain an aggregate real price index for calories from the three grains, we weight the share of each grain by its current aggregate consumption (in calories), and deflated by the United States Consumer Price Index.12/ Figure 10 combines the plot of the stocks to use ratio for calories with the plot of the aggregate calorie price index, both excluding data for China. 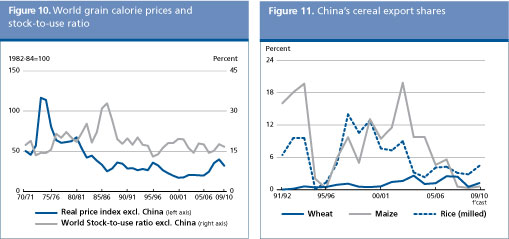
Note that the periods when aggregate stocks are very low, the early 1970s, 1996/1997 and 2007/2008, are all years of sharp upward spikes in the price index from a generally decreasing trend. The exception is 2002/2003, and the reason is clear from Figures 8 and 11. Around that time China exported massive amounts of cereal stocks. In particular, as Figure 11 shows, China exported an unusually large amount of maize from its huge accumulated stocks, as well as a very substantial amount of wheat, cushioning the market in the rest of the world. It did not do this in any other of the high price periods mentioned above. Readers might be surprised at the claim that 1996 was a high price year for aggregate calories from the major grains. A glance at Figures 1 through 3 shows that the price of maize was actually higher in 1996 than any time more recently. The price of wheat was also high, though not quite as high as in early 2008. The point of this discussion is that in the last few decades, periods in which the stocks to use ratio was near its minimum have been associated with a high price of calories, with the exception of one instance early in this decade when a price spike was prevented by unusually large exports from China. Given the recent low level of stocks of grain calories, the high price of aggregate calories is no surprise at all. Note that this conclusion is sharply opposed to the argument that the price crisis was generated by speculators who entered grain markets with large amounts of cash and caused prices to spike through their speculative activity.13/ To increase price, speculation must have reduced consumption, causing a move up the consumer demand curve. (In the short run production is fixed, and speculation certainly did not cause consumption demand to shift to the right. No one was claiming the problem was that consumers were eating more than usual due to speculation.). To reduce consumption, with production predetermined in the short run, speculation must have increased stocks beyond equilibrium levels. The difficulty with the argument is that stocks of aggregate calories were at minimum levels relative to use. In other words, the facts of the market are at odds with the argument that speculation was a major disruptive influence. In fact, the market appears to have reacted to a shortfall of aggregate grain calories much as it has done for at least the last four decades, including the last similar crisis in 1996, when there was no serious claim that speculation was a major disruptive element in need of tighter regulation. Given that low aggregate stocks of calories have been a major factor in the price volatility of the last several years, it makes sense to focus on the reasons for the unexpectedly low level of stocks observed in 2007 and 2008. The next section briefly addresses this question.
The first point to note is that rice stocks were not unusually low in 2007/2008. Wheat production was lower than anticipated, due to an unprecedented extension of a severe Australian drought and to production problems elsewhere. Maize production was high. However stocks were low (but not as low as observed in 1996 or in the early 1970s). One important reason is the large surge in diversion of maize to biofuels. The United States plans to increase biofuels use were clear several years earlier and no doubt influenced the decline in stocks and increase in prices starting early in the current decade. However, policy changes which increased the mandates and a surge in petroleum prices that encouraged processors to exceed the mandates, were important. Other shocks that helped run down global stocks were the unprecedented income surges in China and India, which fostered a rapid expansion in meat demand and in turn in the demand for maize (and a substitute in production, soybeans) as feed. To the extent that the extensions of these surges were unexpected, they caused unanticipated reductions in supplies available to consumers, causing prices to spike high enough to reduce consumption sufficiently to meet the shortfall that remained after accessible stocks had been depleted. Ironically, the largest relative price surge was in the grain least subjected to recent shocks in production or demand, and the least involved in futures and options trading. Rice harvests were not unusually small, on aggregate. Rice demand is also least affected by increased income, as it has a low income elasticity as a food, and is not used significantly as a feed for animals. The shock to demand for rice was largely generated by demand to make up shortfalls in wheat available to consumers. Important factors in this wheat shortage include low harvests and substitution of wheat for maize diverted from animal feed to biofuels in the United States. As discussed elsewhere, (Wright, 2009) the subsequent surge in the price of rice was exacerbated by a panic among exporter governments which progressively reduced access to rice export markets in 2007/2008, initiated by the announcement by India in October 2007 of an export ban, as part of a plan to increase domestic rice consumption to make up for a disappointing wheat harvest. Panic meant the meagre global calorie stocks were not efficiently allocated to those most in need
The grain price spikes of the 2007/2008 are not unusual, if viewed in the context of the history of grain prices over the last several decades. Indeed, excluding the role of China in world cereal exports, the behaviour of calorie prices for maize, rice and wheat during 2007/2008 are not qualitatively different from those of the early 1970s and 1996/1997: the upwards price spikes occurred systematically in periods of unusually low levels of aggregate stocks. The data show no evidence of a new market regime or of perverse effects from international financial speculation. Trends in demand due to income effects from China and India, and from biofuel mandates exacerbated by price increases in petroleum prices all have their part in explaining low stocks during 2007/2008. Consistent with recent empirical estimates of low consumption demand price elasticities for major grain, the high prices of 2007/2008 reflect the magnified effects of low harvests and unexpected shocks related to biofuels demand, in the context of nearly irreducibly low levels of stocks. Furthermore, export restrictions rendered the small remaining discretionary stocks less effective in stabilizing the market as a whole. For the long run prospect of food prices, identification of the implications for price behaviour of production and demand trends, including biofuels demands, poses delicate methodological challenges for further research. Generation of improved data on production, consumption, prices and stocks is equally important. The good news is that the available evidence offers no reason to embark on the more daunting and hazardous task of developing regulatory or other policies to confront a purported new and different regime in global grain markets. Regulatory efforts can instead be focused on the obvious problems in global financial markets.
Caballero, R., Farhi, E. & Gourinchas, P.O. 2008. "Financial Crash, Commodity Prices and Global Imbalances." NBER Working Paper No. 14521, December Cafiero, C., Bobenrieth, E.S.A.,Bobenrieth, J.R.A. & Wright, B.D. (Forthcoming). "The Empirical Relevance of the Competitive Storage Model." Journal of Econometrics, special issue. FAO. Secretariat contribution to defining the objectives and possible decisions of the World Summit on Food Security on 16, 17 and 18 November 2009. FAO, Rome. Roberts, M. & Schlenker, W. 2009. "The U.S. Biofuel Mandate and World Food Prices: An Econometric Analysis of the Demand and Supply of Calories". Preliminary draft. Department of Agricultural and Resource Economics, North Carolina State University, and Department of Economics and School of International and Public Affairs, Columbia University. UNCTAD. 2009. Trade and Development Report UNCTAD /TDR/2009 Wright, Brian D. 2009. "A Note on International Grain Reserves and Other Instruments to Address Volatility in Grain Markets" A technical background paper presented at the World Grain Forum 2009. St Petersburg/Russian Federation. Food and Agriculture Organization of the United Nations, The World Bank, European Bank for Reconstruction and Development.
The full paper along with other Documents presented at the meeting are available at: http://www.fao.org/unfao/bodies/CCP/ba-tf/2009/index_en.htm)
World banana exports are estimated to have risen by one percent to 14.6 million tonnes in 2008. The annual growth rate was slightly below the 20 year average trend and reflected a minor change in the pattern of trade that affected volumes. The marginal expansion in global trade was underpinned by an overall increase in supplies from every region, except the Caribbean where exports continued to contract. Imports by Japan and China rose strongly in 2008 (12.6 and 9.2 percent, respectively), and although the increase in shipments to the United States and the European Union was somewhat below trend, growth remained fairly robust at a respective 3.5 and 1.4 percent. The apparent resilience of import demand to economic recession, especially in countries where the downturn has been severe, is largely on account of competitively priced bananas and tropical fruits vis-à-vis temperate and other substitute fruits and the fact that expenditures on fruits generally form only a small percentage of overall household incomes in such countries. 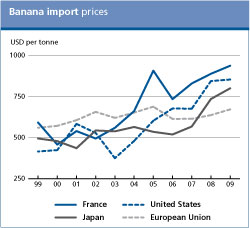
In Latin America, the supply of bananas from Ecuador, the world's largest banana exporting country, increased to 4.7 million tonnes in 2008. Unseasonable weather conditions were not conducive towards crop development, but firm support prices fostered an expansion in plantings. The official minimum price paid to producers was raised to USD 4.7 per box in 2008 up almost USD 1 from the previous year. In July 2009, a price of USD 5.40 was set by authorities, much to the consternation of traders, as the increase coincided with falling market prices in the key import destinations of Europe and the Russian Federation. Export volumes from Colombia also increased in 2008 despite declining competitiveness as a result of the depreciation of the United States Dollars against the Colombian Peso. In Honduras, expanding exports continue to underpin the resurgence of the sector, in the wake of severe damage caused by Hurricane Felix in 2006. Although tropical storms in early June afflicted some banana plantations in Guatemala, weather conditions were generally favourable towards yields and prompted exports to rise by 2 percent in 2008. By contrast, adverse weather resulted in a reversal of productivity gains, registered in Costa Rica and Panama in recent years , causing exports to plummet by more than 9 and 16 percent, respectively. In 2007, a series of tropical storms and hurricanes also affected banana crops in the Caribbean, resulting in a disruption to tradable supplies in the following year. The most devastating of which was Hurricane Dean, a powerful cyclone that left a trail of destruction in Dominica, Guadalupe, Martinique and St Lucia. Subsequently, exports did not return to normal levels until mid-2008. A succession of severe weather events including Hurricane Dean in Jamaica and flooding and wind damage from tropical storms Olga and Gustav virtually wiped out export potential for the country in 2008. The Asian banana market witnessed some notable developments in 2008. India, the largest banana producer in the world, has been exploring the possibility of exporting to the European Union and some trial shipments were conducted in 2008. In the Philippines, the largest exporter of bananas in the region, shipments declined by 1.1 percent to 2.19 million tonnes. Access to the lucrative Australian banana market was further stalled as a Senate Committee recommended that import permits for Philippine bananas not be granted until phytosanitary risk management measures and work plans to be undertaken by the Philippines were independently scrutinized. A larger fall in shipments (13 percent) was recorded by China, but from a significantly smaller base volume. Banana production has been growing rapidly in China, mostly to meet the needs of the domestic market, but if the current pace were to continue, there could be negative implications for future exports from the Philippines, which today account for some 85 percent of China's total banana deliveries. In Africa, exports in 2008 from Cameroon recovered from the weather affected harvest of 2007, but those from Côte d'Ivoire declined by 9 percent.
Regarding prices, average import quotations for bananas in 2008, measured in United Nations Dollars terms, were higher in most countries compared with 2007. The upward momentum was in line with the pervasive increase in the prices of agricultural commodities observed in 2007 to mid-2008. However, banana prices remained strong throughout the year and well into 2009 despite the global economic recession. High import prices of bananas were due to the combined effects of higher input costs, greater freight charges, a weaker United States Dollar, and in Asia, a tighter supply situation due to lower exports from the Philippines. At the retail level, prices in Europe reached a five-year high in April 2008 when the price reported in France reached EUR 1.88 per kg, but the seasonal downturn, which usually occurs in the second half of the year as demand for bananas in summer falls, reduced the average for the year to EUR 1.69/kg. Nevertheless, in United States Dollar terms, the average price of 2.48 per kg in 2008 was the highest in decades. The upward trend in prices has continued well into 2009, and prices look set to register a successive record.
Tropical fruits are important to developing countries from both a nutritional and export-revenue perspective. They are cultivated widely in the tropics at commercial and subsistence levels and until the 1970s, were mostly utilized for domestic consumption. These fruits are relatively cheap and provide a ready source of vitamins and minerals. In recent years trade volumes have expanded dramatically, as developing countries increasingly regard tropical fruits as an attractive option for diversification away from traditional export crops, which have experienced downward trends in prices. However, exports to major markets are required to comply with internationally certifiable production, food safety and quality standards, which can be very stringent and hence costly.
World production of tropical fruits was estimated at over 82.7 million tonnes in 2008, slightly more than produced in the previous year. Mango dominatated global output with a share of almost 40 percent. World production of pineapples comprised about 25 percent, followed by papaya at 10 percent and avocado at 4 percent. The minor tropical fruits, i.e. those that are generally traded in smaller volumes, such as lychees or litchis, durian, rambuttan, guavas and passion fruit, recorded a combined output of 17.8 million tonnes in 2008 or roughly 22 percent of all tropical fruit production. Asia is by far the largest producing region for tropical fruits, followed by Latin America and the Caribbean, Africa and Oceania. In 2008, Asia was the most important producer of mangoes, accounting for 74 percent of world production. Latin America and the Caribbean had a share of 16 percent, Africa 10 percent, and the balance was produced in Oceania. Pineapple output in 2008 was also governed by Asia with a share of 49 percent of global production, followed again by Latin America and the Caribbean (38 percent) and Africa (12 percent). The Latin America and the Caribbean region accounted for over two-thirds of world avocado production and 39 percent of all papaya output. Data on minor tropical fruits remain scarce, but an assessment has been made from returns made by some producing countries, as well as industry sources. Of the estimated 17.8 million tonnes of minor tropical fruits produced in 2008, guava accounted for 27.5 percent with an output of 4.9 million tonnes, lychees 2.8 million tonnes, longan 2.4 million tonnes, durian 1.9 million tonnes, rambuttan 1.7 million tonnes and passion fruit nearly 1 million tonnes.
About 90 percent of the tropical fruits produced globally are consumed in producing countries themselves, exchanged on formal and informal markets. Some 10 percent is traded internationally; 5 percent as fresh fruits and a similar proportion traded as processed products. The overall contribution to farm/rural household incomes is significant with the value of production of tropical fruits estimated at USD 43.7 billion in 2008. Although internationally traded fresh tropical fruit produce represents only a small proportion of the total volume produced, quantities are relatively large compared with temperate fruits, and export values are significant. In 2008, the total value of international trade of fresh tropical fruits was USD 4.5 billion, compared with USD 7.5 billion for bananas, USD 6.2 billion for apples, USD 3.3 billion for oranges and USD 2.2 billion for pears. Processed tropical fruit transactions were valued at USD 1.9 in 2008. Revenue data for exports and re-exports in 2008 indicate a 1.5 percent increase in fresh tropical fruits, with a moderate increase of 3 percent registered for mangos and papayas and a small increase of 2 percent for pineapples. The surge in exports of MD-2 pineapples from Costa Rica, which peaked at an unprecedented 1.1 million tonnes in 2006, has underpinned the growth in fresh pineapple trade, but has since slowed down in 2008. Exports of avocadoes on the other hand declined by around 5 percent to 623 500 tonnes. Exports of minor fruits registered a relatively strong growth of over 3 percent in 2008, as regional demand in Asia remained steadfast in spite of the economic recession. The United States is the largest importer of fresh tropical fruits followed by the European Union, Japan and China. The United States and the European Union together accounted in similar proportion for some 75 percent of world imports of pineapple, mango, papaya and avocado in 2008. Global inflows of minor tropical fruits on the other hand were mostly destined for China, Malaysia and Singapore, as demand for these fruits tends to be concentrated in Asia.
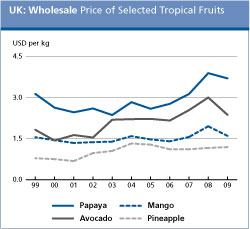
Price information varies widely depending on quality and origin. In the United Kingdom, annual average wholesale prices for tropical fruits expressed in United States Dollars have increased in 2008, albeit at varying degrees, underpinned by strong demand. However, reported prices for 2009 indicate a decline relative to 2008, except for pineapples. For instance, the decline in the price of avocado over January to September 2009 was 21 percent, mango and papaya by 18 and 5 percent, respectively, while pineapple prices increased by 2.4 percent. Such price developments are in stark contrast to the period between 2005 and 2008, when avocado prices rose by 35 percent, while papaya and mango prices increased by 50 and 32.5 percent, respectively. Prices for pineapples increased substantially in the middle of the decade, before declining by a cumulative 9 percent by 2008, reflecting the decline in supplies of smooth cayenne from Africa and an over reaction of MD2 producers to the dramatic growth in demand.
9. The authors wish to thank Carlo Cafiero for help with this paper, and Di Zeng for excellent research assistance. 10. See Cafiero et al., (forthcoming). 11. Roberts and Schlenker (2009) also address the global market for calories from grains, but they include calories from soybeans. 12. When export share is used as weight, the two price indices are almost indistinguishable. 13. Claims of speculative behaviour are highly heterogeneous and hence difficult to evaluate. For example, Caballero, Farhi and Gourinchas (2008) state that the crisis involving the crash of the real estate market "exacerbated the shortage of assets in the world economy, which triggered a partial recreation of the bubble in commodities and oil markets in particular."On the other hand, the 2009 UNCTAD Trade and Development Report states (p. IV):"It is true that deteriorating global economic prospects after September 2008 dampened demand for commodities; but the downturn in international commodity prices was first triggered by financial investors who started to unwind their relatively liquid positions in commodities when the value of other assets began to fall or became uncertain"We further note that the quoted UNCTAD report (p. IV) apparently sees the above observation as evidence that "the signals emanating from commodity exchanges are getting to be less reliable as a basis for investment decisions and for supply and demand management by producers and consumers." |
| GIEWS | global information and early warning system on food and agriculture |